Background

Tbh, this challenge is really, really cool, it teaches you the fundamental skills in Microsoft Excel. Lol
The possibility of a weapon that alters the very core of the structure of the universe itself is beyond even the wildest imaginations. Or is it? Ramona and Paulie are exeperimenting with concentric Dyson spheres to achieve the impossible, to harvest the energy of an entire quasar in order to create such a weapon. The exepriments showed that five spheres are the optimal solution. Alas, the thermal equilibrium is still a pressing issue they need to figure out. They measure the temperature of each sphere for every minute. Now all that is left is to properly analyze the data and figure out why there are so many thermal inconsistencies
Now, please note that, sometimes challenge info could has some valuable information.
Solution
As the challenge has a downloadable file. Let's download it and unzip it.
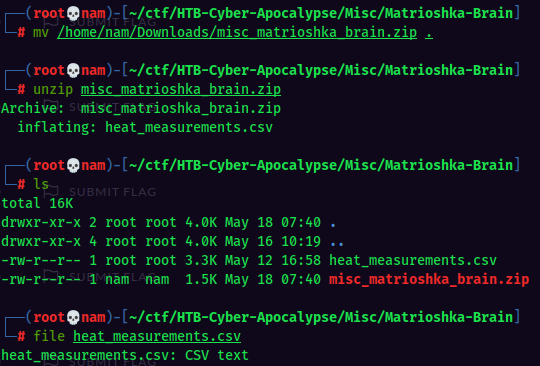
Hmm… a CSV text file. I remember I can open it in Microsoft Execl. Let's transfer this file to my Windows 10 host machine.
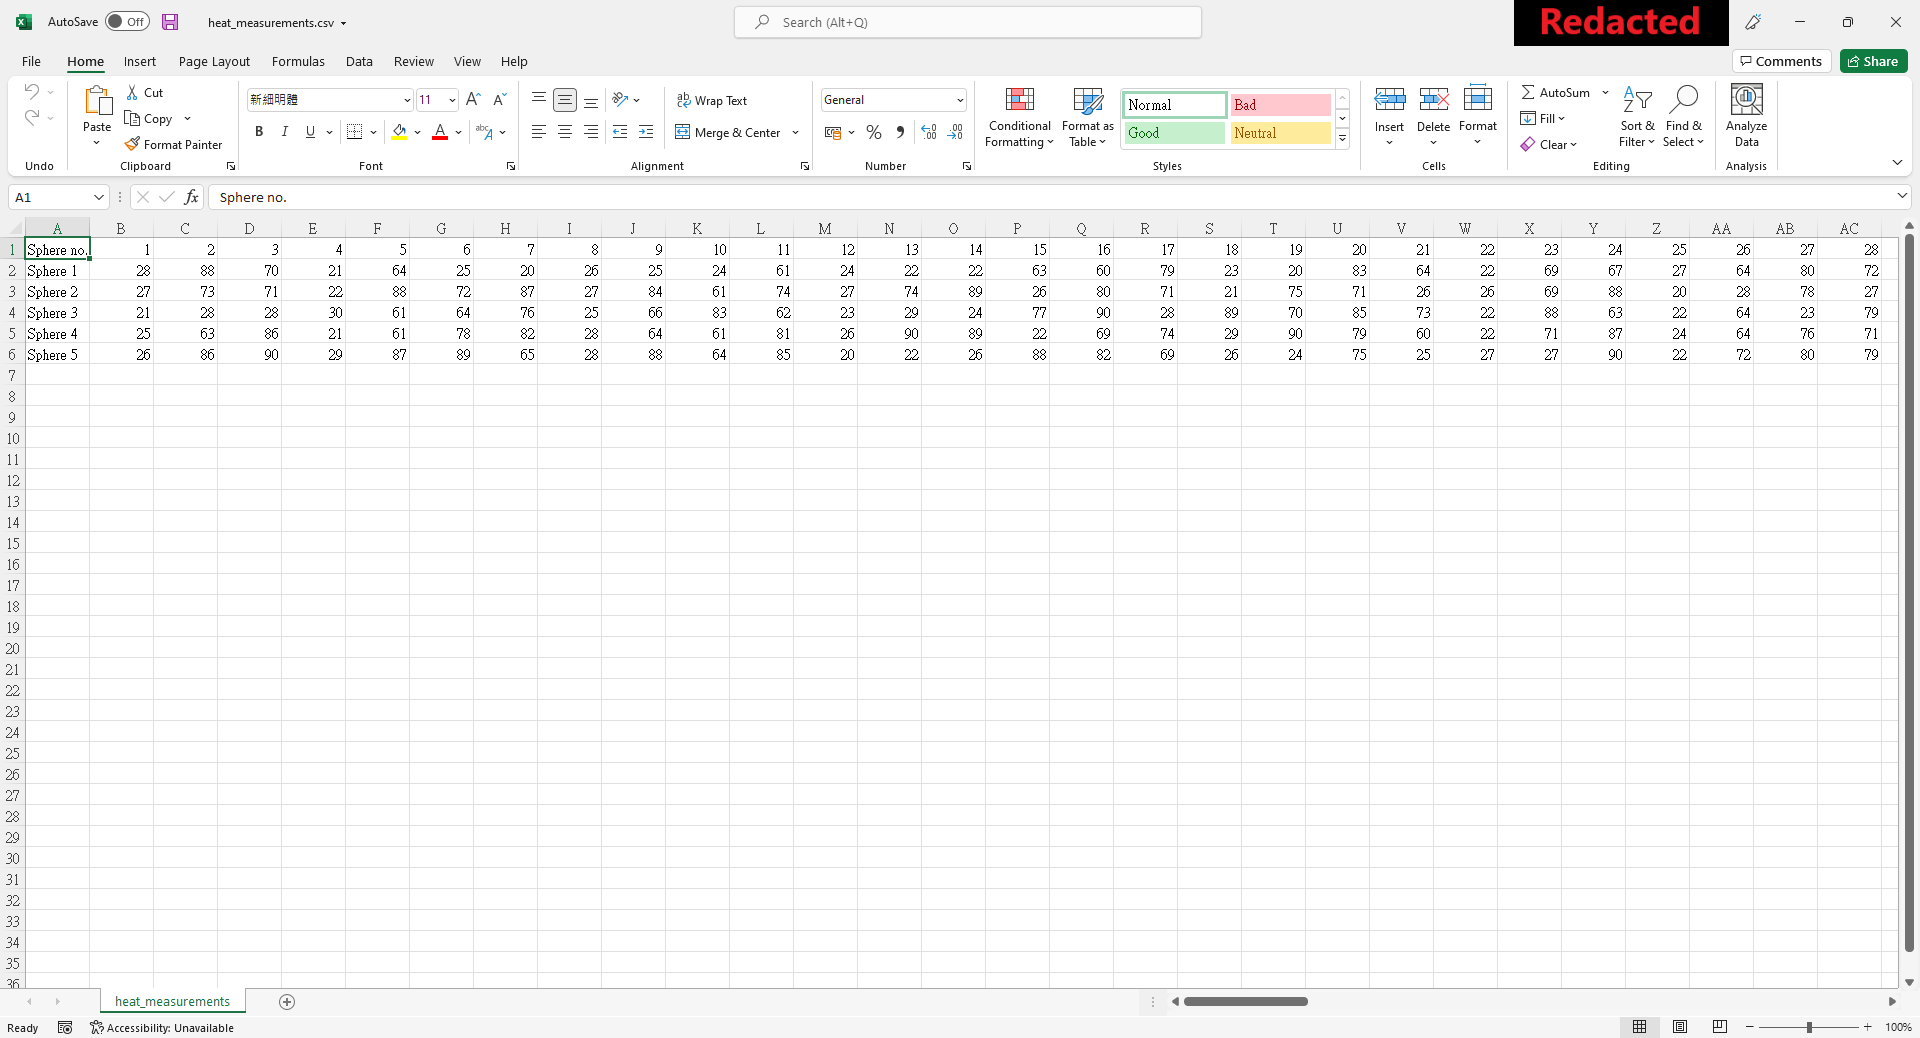
It looks like just some thermal data of those five spheres that depicted in the challenge info.
Wait a minute… Do you remember the challenge info said:
why there are so many thermal inconsistencies
We indeed see some inconsistencies value, like in column 3.
So maybe we can hightlight those abnormal data, and the flag will be appeared?? Let's test our theory.
First, we can select all the data except first column and row.

Then, I'll use Greater Than in Conditional Formatting.
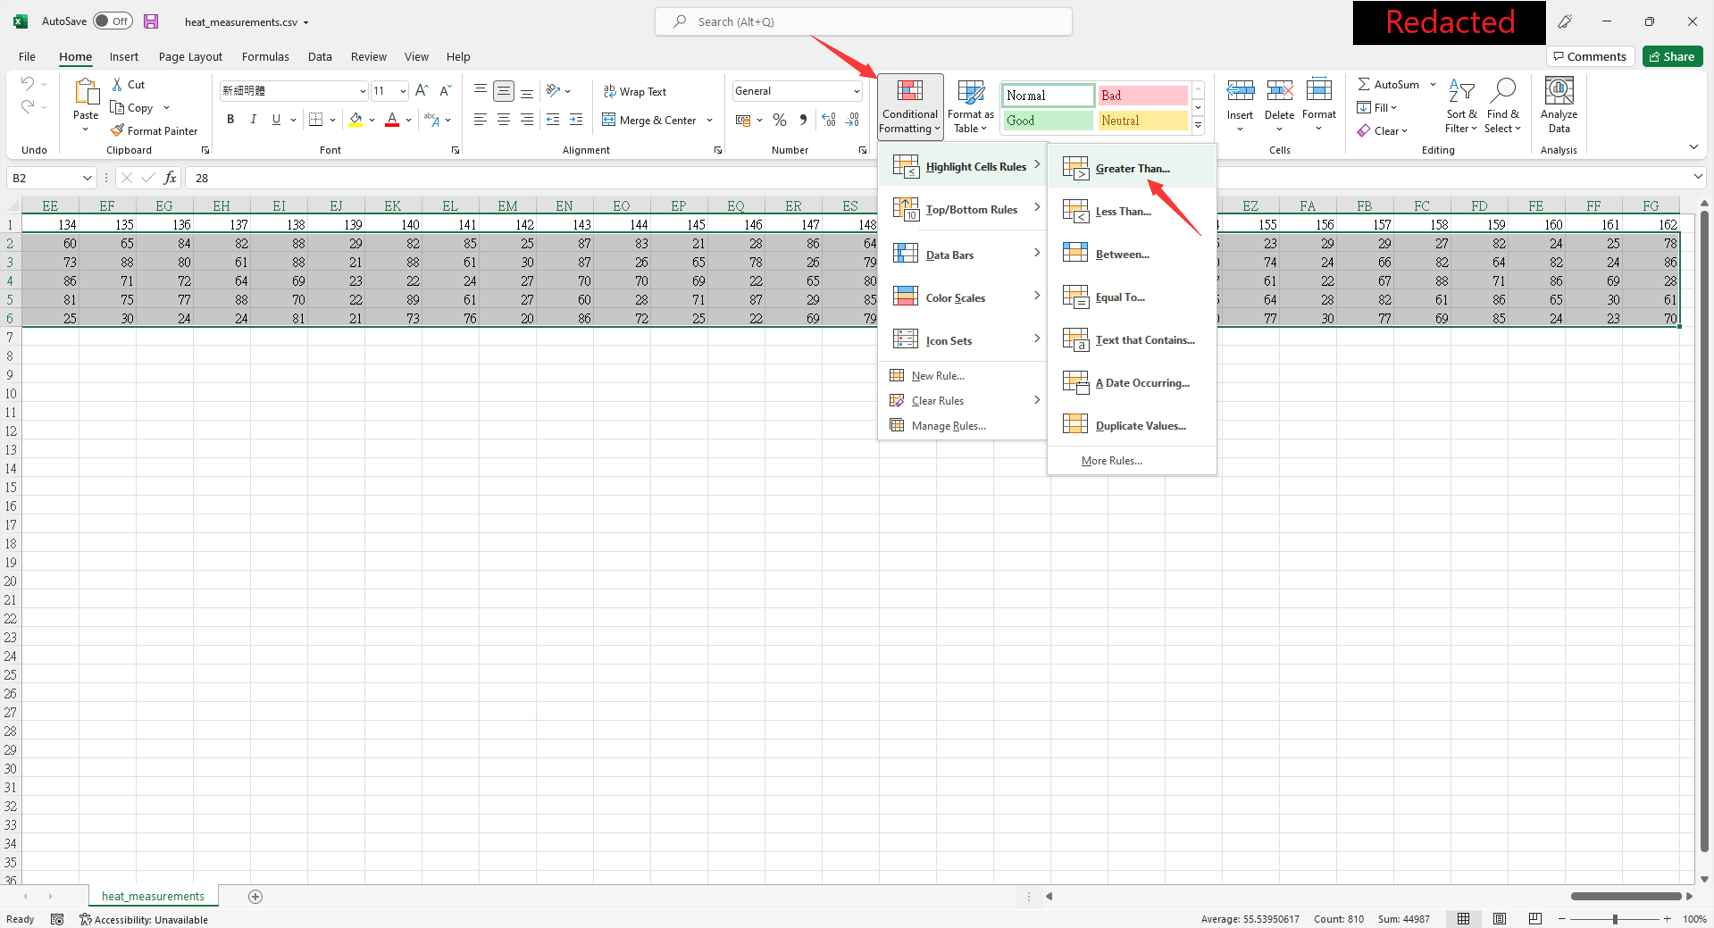

Hmm… Let's try 35, so all thermal data that are > 35 will be highlighted.

Seems like it's not the flag?? Then let's try Less Than in Conditional Formatting.
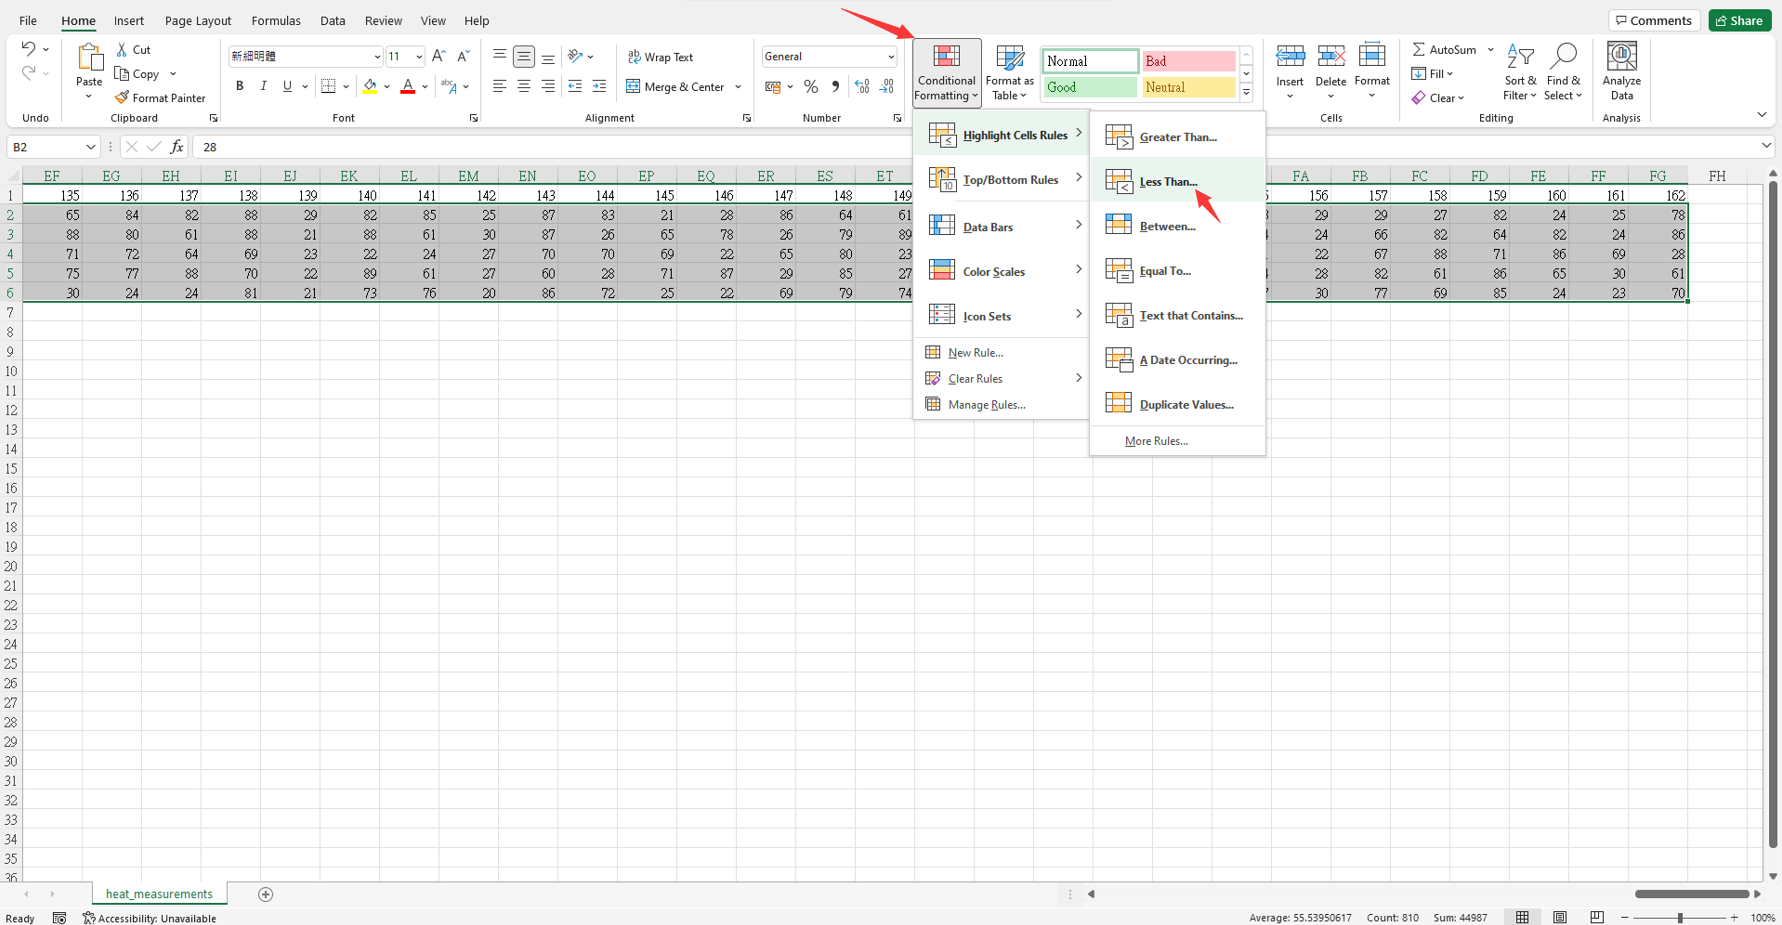


And boom!!! There's our flag, as the flag has a prefix of: HTB{.*?}
(P.S. The above image doesn't show the whole flag. If you're interested in this challenge, you can download the zip file and try it by yourself. :D)
Flag
HTB{1MM3NS3_3N3RGY_1MM3NS3_H34T}